
There are paid for apps that provide extra flexibility, but i thought i could make use of custom summary formula and a clever way of using an opportunity formula field to set the targets. This solutions means no extra objects are required and no need to use collaborative forecasting.
My final result displayed on the dashboard looks like this:

steps to reproduce:
1 - to set the targets on a monthly basis throughout the year:
create a formula(number) field on opportunity product

our release_code_1 field is a date field for when money is collected so for every product sold this field is populated and means we can use month() to put that value as a month value and then use case to allocate the monthly target values
2 - create report
create a opportunity / opportunity product report type with the new rd__c field included
set the main filters to all opportunities/date field as revenue release date and the date range to current cy
apply any additional filters as appropriate
in the matrix/summary report row grouping is the date field (group this field by month) and in column grouping use sum of amount or sum of net value before vat (from product) - it is here that you add custom summary formula - which i called monthly target:

your matrix would like this:

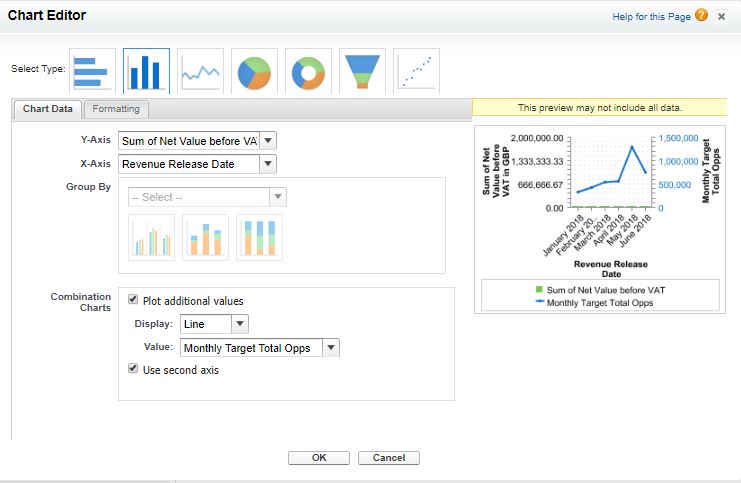
3 - add a chart on the report
for chart data you can use sum of net value or sum of amount depending on how you have previous customised currenct data in either opportunity/opportunity-products, x axis would be the date field you use in the report then check plot additional fields where display is line and value is monthly target (custom summary formula) also check use second axis
for formatting, add the legend to the bottom, check show axis label and check enable hover, also set the y-axis to manula starting at 0 and ending with the same value as the second axis (this ensures the two y axis align) if you dont do this your target will look like its below the actual when actually the figures say target hasn't been achieved

that is it - easy
and feel free to comment
i am actually working on a better solution where i am building a quota object where its the parent object of opportunity via a lookup on opportunity. in this object will be the target value, the opp owner, and a rollup of opportunity amount and other currency fields on opp/opp product as well as product divisions and company regions. i will elaborate further when that is complete, but obviously this will require code to pull data on to quota__c from opportunity and opportunity product........watch this space